

Rufus and I always enjoy the NFL post-season projections we update throughout the season. Frankly it might be our favorite product. This year we decided to put together something similar on the college side. But since the playoff committee lies beyond a humble quant’s domain, we have to approach it a little differently.
Our projections will include the obvious bits, like expected wins, the probability of going undefeated, etc. But we also want to speak to each team’s chances of making the playoff. We’ve decided to do that by forecasting the landscape at the end of the season – which teams will be “in the conversation” for the playoff. We actually think that’s both pretty much what fans want for their team, and not too hard to specify. So that’s our new post-season metric: in the conversation (ITC).
In brief: If you’re a power-5 team with 1 or fewer losses you’re in the conversation. If there aren’t enough of those, and you’re a power-5 team with 2 losses, you’re in the conversation. If you’re in contention to win the SEC, you’re in the conversation. Group-of-5 times have a tougher time but we build an avenue for them, too. This approach give us ~6.5 teams a year, on average, never less than 4 and often many more. For describing the landscape at the end of the regular season, this feels about right.
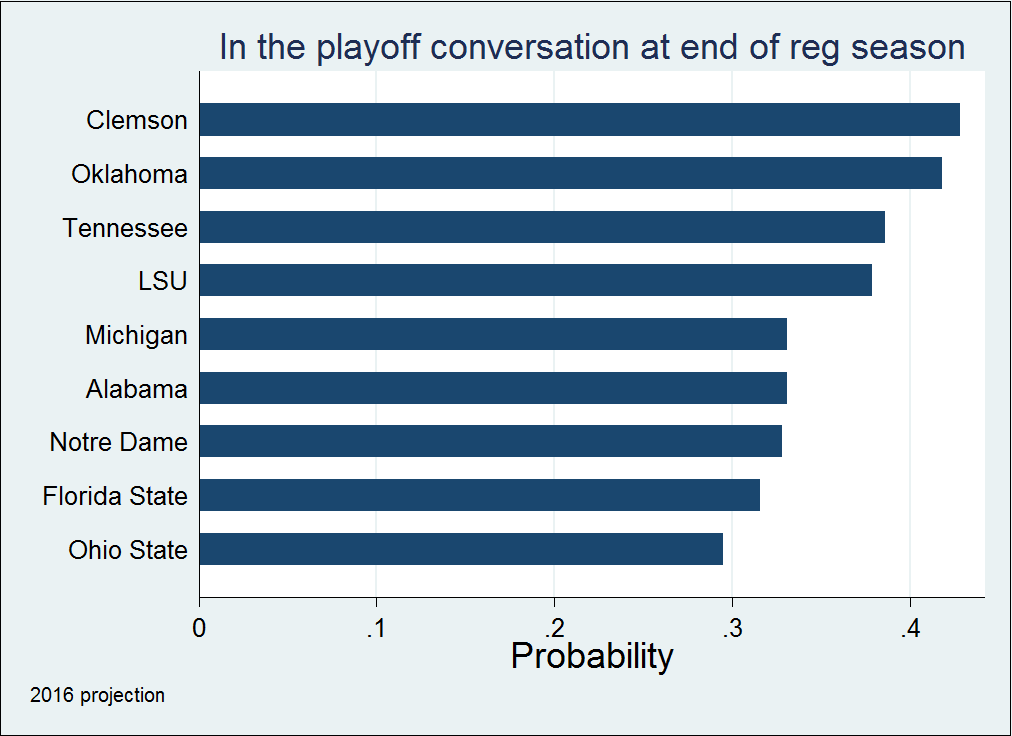
Using our shiny new sim, we find the teams most likely to be “in the conversation” at the end of the 2016 regular season are Clemson (43%), Oklahoma (42%), Tennessee (39%) and LSU (38%). Now you have to puzzle through conference championships to translate that into a playoff berth. E.g., it’s unlikely if not impossible that both Tennessee and LSU would advance. So we need to dig a little deeper. This year there is another set of 5 teams that are closely bunched, and distinctly above those who come after them: Alabama (33%), Michigan (33%), Notre Dame (33%), FSU (32%) and Ohio State (30%). So those are our 9 favorites for the playoff, heads-and-shoulders above the rest. SEC, ACC and Big 10, all with multiple teams represented in this elite group, look like robust picks for the playoff.
An important insight from the simulations fueling these projections is how often the unexpected occurs. The teams we currently think are best are definitely the ones mostly likely to make the playoff conversation. But each year there are about as many unexpected teams in the conversation as expected teams. On average 3.5 (of 6.6!) of the teams “in the conversation” began the season outside the Top 10. Of course by definition those teams are harder to identify. Here’s a deeper look at our ITC projections to surface the strongest candidates:
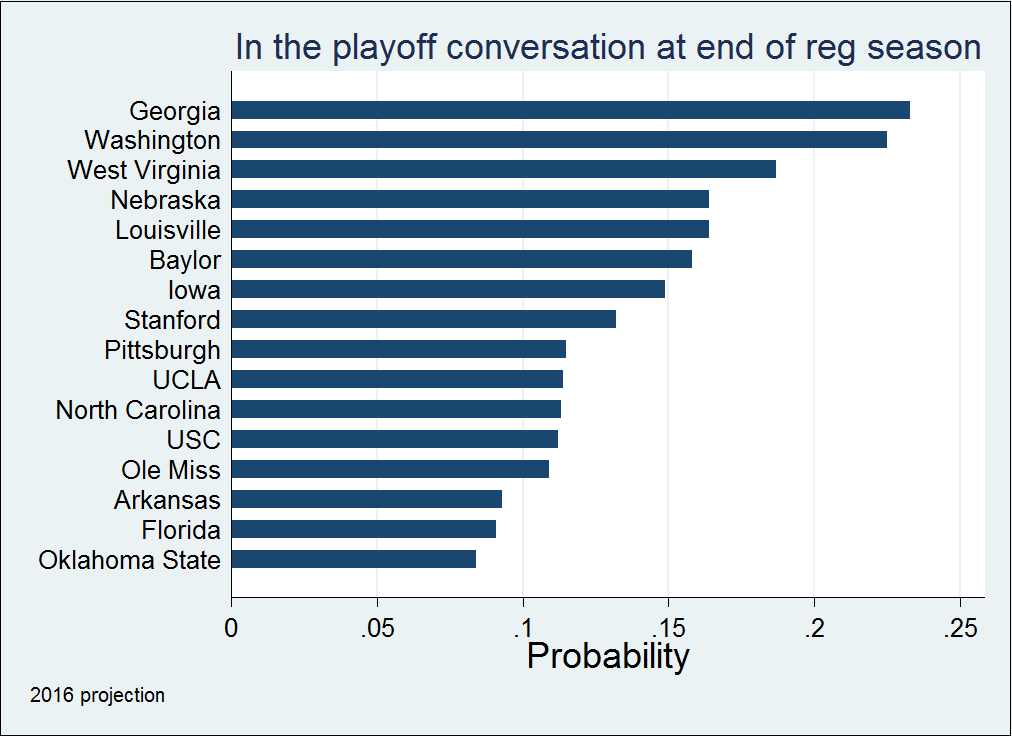
The least dark of the darkhorses are Georgia and Washington. Either of them are fully capable of getting on a run and forcing their way into consideration. Georgia looks like the second best team in a pretty wide open SEC East. The QB situation works out okay, and/or Tennessee does something Tennessee-like, and they’re right there. Washington is the favorite out of what is expected to be cannibal-fest in the Pac 12. But are they really that far from getting through that schedule with only 1 loss? Not much of a stretch, really. We put them both over 20% for being in the conversation.
Our favorite dark horse is West Virginia. Despite not receiving a single pre-season vote in the AP or Coaches Top 25, we have them the team 12th most likely to be in playoff conversation at the end of the regular season. We believe they are an entirely decent team (#26) playing one of the softest power-5 schedules out there in a pretty wide open Big 12. Well, pretty open other than OU. But that’s the thing about baking enough uncertainty into your projections – teams that look like OU in August often look quite different in November. Altogether we give the Mountaineers an almost 20% chance to be in the conversation.
Nebraska and Iowa show up prominently, no doubt due to the availability of an “Iowa in 2015” strategy – dash through a soft Big10 West schedule and pray the gods shine on you in the conference final. Louisville is a stout team blocked, seemingly, by two of this year’s monsters. Stanford, UCLA and USC are hoping for the same kind of unexpected break from the pack that Washington is eyeing, just with a bit steeper climb.
All good fun. Odds are we’ll be talking about multiple teams from this second tranche at the end of the regular season. A good reminder as we obsess over whether FSU can trump Clemson with a frosh QB and if LSU can finally get by Alabama.
Here’s the full projection for our Top 35. “Lose<3” is the probability of losing less than 3 regular season games, “Lose<2” less than 2, and “Lose<1” undefeated. “ITC” is what we’ve been discussing – the probability of being “In The Conversation”.
| ITC_rank | Team | MP | MP_rank | E(Wins) | Lose<3 | Lose<2 | Lose<1 | ITC |
| 1 | Clemson | 21.30 | 3 | 9.8 | 62% | 37% | 13% | 43% |
| 2 | Oklahoma | 19.18 | 6 | 9.7 | 61% | 36% | 13% | 42% |
| 3 | Tennessee | 20.65 | 5 | 9.5 | 55% | 29% | 10% | 39% |
| 4 | LSU | 21.72 | 2 | 9.4 | 52% | 30% | 9% | 38% |
| 5 | Alabama | 23.39 | 1 | 9.3 | 49% | 24% | 8% | 33% |
| 6 | Michigan | 14.39 | 11 | 9.4 | 51% | 28% | 9% | 33% |
| 7 | Notre Dame | 16.25 | 9 | 9.3 | 50% | 28% | 10% | 33% |
| 8 | Florida State | 21.00 | 4 | 9.2 | 50% | 26% | 9% | 32% |
| 9 | Ohio State | 16.94 | 7 | 9.0 | 44% | 25% | 6% | 29% |
| 10 | Georgia | 16.07 | 10 | 8.6 | 33% | 18% | 4% | 23% |
| 11 | Washington | 13.95 | 14 | 8.8 | 38% | 19% | 7% | 22% |
| 12 | West Virginia | 11.79 | 20 | 8.4 | 32% | 15% | 5% | 19% |
| 13 | Nebraska | 9.73 | 26 | 8.2 | 29% | 13% | 3% | 16% |
| 14 | Louisville | 14.24 | 12 | 8.5 | 32% | 12% | 3% | 16% |
| 15 | Baylor | 11.14 | 23 | 8.4 | 30% | 11% | 3% | 16% |
| 16 | Iowa | 7.42 | 34 | 8.0 | 25% | 12% | 3% | 15% |
| 17 | Stanford | 13.27 | 15 | 7.9 | 25% | 11% | 3% | 13% |
| 18 | Pittsburgh | 11.62 | 21 | 8.0 | 25% | 9% | 2% | 12% |
| 19 | UCLA | 10.77 | 25 | 7.5 | 20% | 9% | 2% | 11% |
| 20 | North Carolina | 12.24 | 18 | 8.0 | 24% | 8% | 2% | 11% |
| 21 | USC | 14.09 | 13 | 7.5 | 19% | 9% | 1% | 11% |
| 22 | Ole Miss | 16.46 | 8 | 7.6 | 18% | 8% | 1% | 11% |
| 23 | Arkansas | 12.35 | 17 | 7.2 | 14% | 6% | 1% | 9% |
| 24 | Florida | 12.24 | 19 | 7.5 | 14% | 6% | 1% | 9% |
| 25 | Oklahoma State | 8.83 | 28 | 7.5 | 17% | 6% | 1% | 8% |
Method & Notes
We’ll go into more detail on our sim at some point in the future. The main thing to know there is that we’ve matched the amount of variance in our sim to what we’ve seen on the field the last 10 years.
Defining “in the conversation” is arbitrary but at least it can be objective. We also don’t think it’s hard to do this reasonably well. Our criteria:
- Power-5 teams with 0 or 1 loss.
- If there are <4 P5 teams with 0 or 1 loss, any P5 team with 2 losses.
- The SEC team(s) with the fewest losses.
- Any undefeated Group-of-5 team, as long as their SOS is higher than 80th (totally arbitrary) and 2-loss P5 teams are “in the conversation” (i.e., an undefeated G5 team will not bump out a 1-loss P5 team).
It’s not perfect, but it’s simple, and will get us going. We can refine down the road as needed.
Those criteria give you 6-7 teams on average, with some years producing many more. This is the full distribution from the sims we’ve run on the last 10 seasons (always from the pre-season vantage).
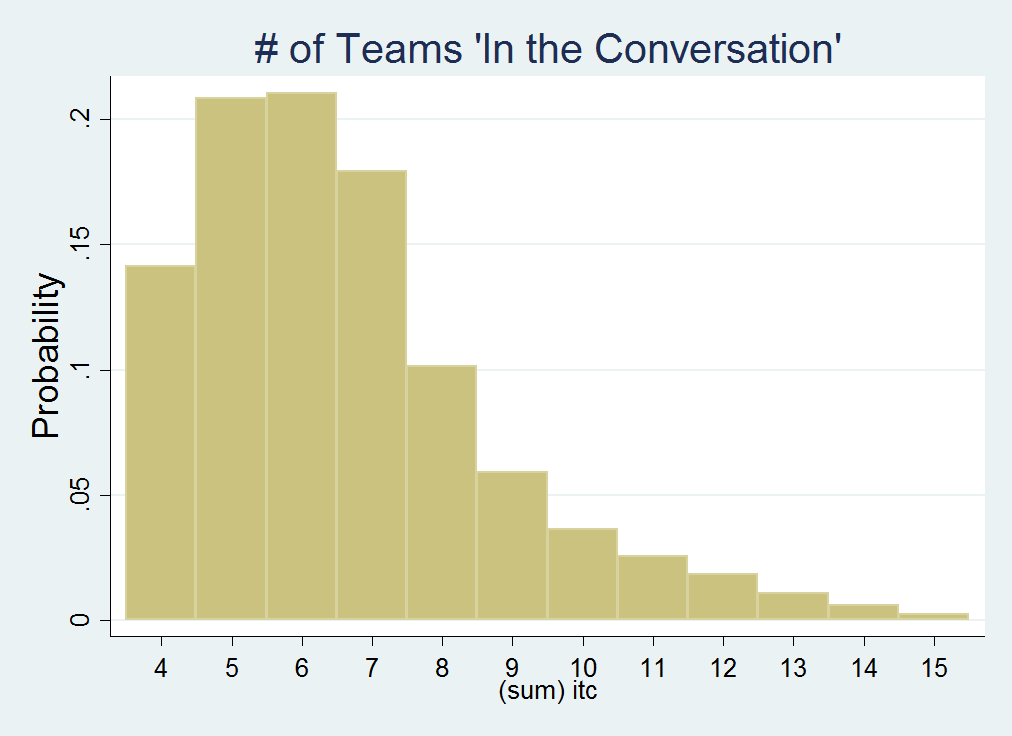
The vast majority of seasons should see 4-8 teams in the consideration set. 90% of the time it is 9 or fewer, and the most likely number is 5 or 6. This sounds about right to us. That right tail is interesting, though. That’s the remote but real possibility that we have a glorious meltdown with 10-15 teams credibly vying for a seed.
What did these numbers say about the 2014-2015 playoff teams?
|
Year |
Seed | Team | AP pre-season | MP pre-season | ITC | ITC_rank |
| 2015 | 1 | Clemson | 12 | 19 | 17% | 15 |
| 2015 | 2 | Alabama | 3 | 2 | 34% | 3 |
| 2015 | 3 | Michigan St | 5 | 7 | 32% | 4 |
| 2015 | 4 | Oklahoma | 19 | 8 | 25% | 8 |
| 2014 | 1 | Alabama | 1 | 2 | 41% | 4 |
| 2014 | 2 | Oregon | 3 | 3 | 51% | 2 |
| 2014 | 3 | Florida St | 2 | 1 | 73% | 1 |
| 2014 | 4 | Ohio State | 5 | 5 | 51% |
3 |


